
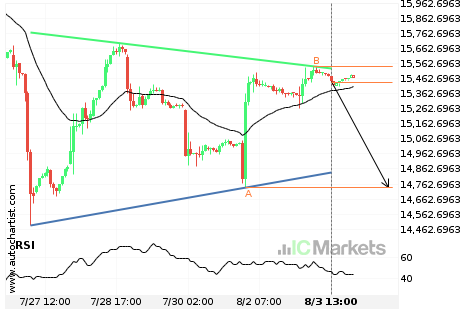
FTSE China A50 Index – getting close to support of a Triangle
FTSE China A50 Index is moving towards the support line of a Triangle. Because we have seen it retrace from this line before, we could see either a break through this line, or a rebound back to current levels. It has touched this line numerous times in the last 8 days and may test it […]

Australia 200 Index – getting close to resistance of a Channel Up
Australia 200 Index is moving towards the resistance line of a Channel Up. Because we have seen it retrace from this line before, we could see either a break through this line, or a rebound back to current levels. It has touched this line numerous times in the last 5 days and may test it […]

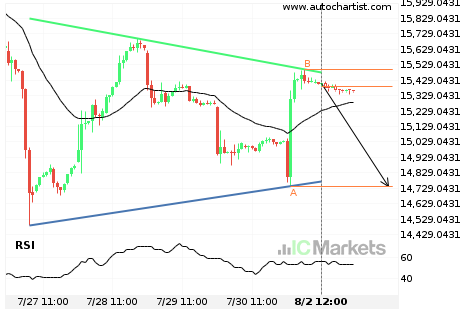
Either a rebound or a breakout imminent on FTSE China A50 Index
FTSE China A50 Index is heading towards the support line of a Triangle. If this movement continues, we expect the price of FTSE China A50 Index to test 14741.0800 within the next 18 hours. But don’t be so quick to trade, it has tested this line numerous times in the past, so this movement could […]
Where is Australia 200 Index moving to?
A movement of 1.13% over 3 days on Australia 200 Index doesn’t go unnoticed. You may start considering where it’s heading next, a continuation of the current upward trend, or a reversal in the previous direction.

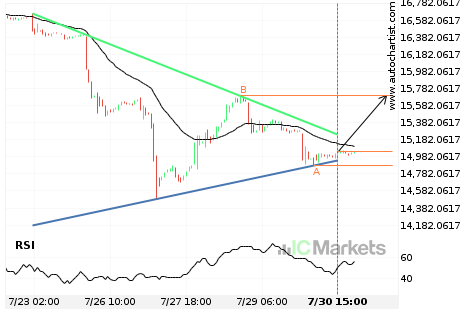
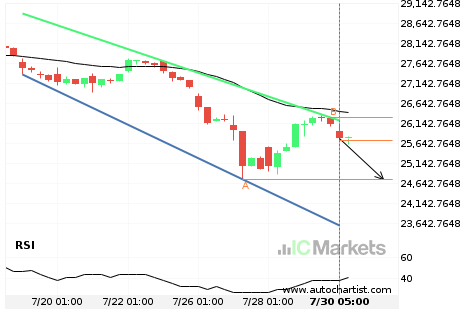
FTSE China A50 Index – getting close to resistance of a Triangle
FTSE China A50 Index is moving towards the resistance line of a Triangle. Because we have seen it retrace from this line before, we could see either a break through this line, or a rebound back to current levels. It has touched this line numerous times in the last 8 days and may test it […]
Hong Kong 50 Index – getting close to support of a Channel Down
Hong Kong 50 Index is moving towards the support line of a Channel Down. Because we have seen it retrace from this line before, we could see either a break through this line, or a rebound back to current levels. It has touched this line numerous times in the last 12 days and may test […]
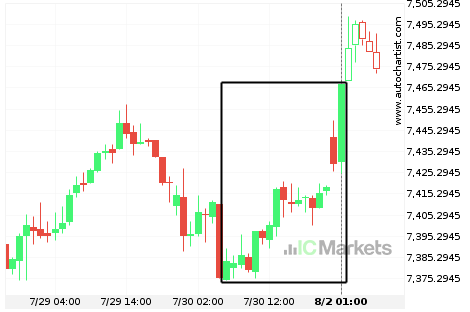
What’s going on with Hong Kong 50 Index?
Those of you that are trend followers are probably eagerly watching Hong Kong 50 Index to see if its latest 1.88% move continues. If not, the mean-reversion people out there will be delighted to cash in on this exceptionally large 9 hours move.